
TAM is the revenue ceiling for your entire market. SAM is the slice your product and channels can realistically reach. SOM is the near-term share you can actually capture and close. Use TAM to frame opportunity for investors, SAM to set strategy and targeting, and SOM to drive go-to-market targets and financial forecasts. Per the HubSpot guide on market sizing, presenting all three together, with clear distinctions, is the standard investors expect.
Three mini-formulas to keep handy:
- TAM = Total addressable customers × Average annual revenue per customer
- SAM = TAM × Serviceable segment percentage
- SOM = SAM × Realistic capture rate
The numbers must shrink as you move from TAM to SAM to SOM. If they don't, the math is wrong.
Key Takeaways
TAM, SAM, and SOM are only useful when all three are calculated together, grounded in real inputs, and tied directly to your sales capacity and go-to-market plan.
| Point | Details |
|---|---|
| TAM is the ceiling, not the plan | Use TAM to frame investor opportunity; never use it as an operational target. |
| SAM defines your targeting universe | The filters that shrink TAM to SAM are the exact parameters for your ICP and channel strategy. |
| SOM must follow from capacity | Build SOM from reps × quota × close rate, not by picking a percentage of SAM. |
| Run both methods and reconcile | Top-down and bottom-up estimates should land within a reasonable range; wide divergence means assumptions need review. |
| Document every assumption | Named data sources, sensitivity ranges, and unit consistency are what separate a credible slide from a guess. |
Table of Contents
- What are TAM, SAM, and SOM, and how do they differ?
- How do you calculate TAM, SAM, and SOM?
- Two worked examples you can adapt for your pitch deck
- What if no market report exists for your category?
- Common mistakes founders make and what investors actually look for
- Where to find U.S. data inputs for your market-sizing model
- Quick reference: formulas, units, and pitch-deck checklist
- SOM vs. market share: they measure different things
- How TAM, SAM, and SOM connect to your go-to-market plan
- Why SOM is the only number that actually runs your business
- Sources
What are TAM, SAM, and SOM, and how do they differ?
The three metrics nest inside each other like concentric circles. TAM sits on the outside, SOM at the center.
It's a sizing tool, not a plan. When presenting to VCs, express TAM in annual revenue dollars (ARR or annual spend). For operational planning, customer counts work fine.
Serviceable Addressable Market (SAM) is the portion of TAM your product can actually serve given your current offering, pricing, geography, and distribution channels. A U.S.-only SaaS product targeting mid-market companies has a SAM that excludes enterprise accounts requiring custom contracts, international markets, and segments your pricing doesn't fit.
Serviceable Obtainable Market (SOM) is the realistic share of SAM you can win in the near term, typically a 1–3 year horizon, given your sales capacity, marketing reach, and competitive position. Deckary's TAM/SAM/SOM calculator benchmarks SOM at 1–5% of SAM for new market entrants and 5–15% for established players.
A few unit-choice rules worth following:
- Use revenue (ARR, ACV, annual spend) when presenting to VCs and angels — it maps directly to their return models.
- Use customer counts or units for operational planning, sales quota-setting, and hiring decisions.
- Never mix units within a single calculation. If TAM is in dollars, SAM and SOM must be in dollars too.
One red flag to watch: founders sometimes show a SAM larger than their TAM after applying filters. That means a filter was applied incorrectly or a segment was double-counted. The funnel only flows one direction.
How do you calculate TAM, SAM, and SOM?
Two methods dominate: top-down and bottom-up. Running both and reconciling them is the best practice most investors expect at Series A and beyond.
Top-down calculation
Start with an authoritative industry figure from an analyst report (Gartner, IBISWorld, or a government source), then apply filters to narrow it to your relevant slice.
Filters to apply in sequence:
- Geography: Remove markets where you don't operate or can't legally sell.
- Buyer segment: Strip out company sizes, income bands, or demographics outside your ICP.
- Pricing tier: Exclude segments your price point can't serve (too expensive or too cheap).
- Channel reach: Remove buyers you have no realistic path to reach.
Top-down is fast and credible for early-stage decks because it anchors to published data. Its weakness: the filters are judgment calls, and investors know it.
Bottom-up calculation
Build from unit economics upward. The inputs you need:
- Number of reachable target customers (from CRM data, B2B intent data, or Census/BLS counts)
- Average contract value (ACV) or average revenue per user (ARPU)
- Realistic conversion rate from your channel
- Sales capacity (reps × quota × close rate)
Bottom-up is harder to build but far more defensible. GoNoGo.team notes that if your top-down and bottom-up estimates diverge by an order of magnitude, your assumptions need a hard review before you put the numbers in a deck.
Hybrid best practice
Run both methods. That table does more for investor credibility than any single headline number.
Pro Tip: Document every assumption in a separate tab of your model. Investors will ask. Having a clean assumptions log signals discipline and makes Q&A faster.
Two worked examples you can adapt for your pitch deck
Example A: B2B SaaS (annual contract value)
Scenario: A U.S.-based project management SaaS targeting mid-market companies (100–1,000 employees) in professional services.
Assumptions:
- U.S. professional services firms with 100–1,000 employees: approximately 85,000 companies (U.S. Census data)
- ACV: $12,000 per year
- SAM filter: English-language product, U.S. only, companies with existing project management budget = 60% of total
- SOM capture rate: 3% (new entrant benchmark)
Calculation steps:
- TAM = 85,000 companies × $12,000 ACV = $1.02 billion
- SAM = $1.02B × 60% = $612 million
- SOM = $612M × 3% = $18.4 million
Both scenarios are worth showing.
Example B: Consumer retail (units per household)
Scenario: A U.S. direct-to-consumer brand selling premium reusable water bottles, targeting health-conscious households with income above $75,000.
Assumptions:
- U.S. households with income above $75,000: approximately 52 million (U.S. Census)
- Average annual spend per household on reusable drinkware: $45
- SAM filter: online shoppers in that income band = 70% of total
- SOM: available through 3 online channels reaching an estimated 8% of SAM
Calculation steps:
- TAM = 52,000,000 households × $45 = $2.34 billion
- SAM = $2.34B × 70% = $1.638 billion
- SOM = $1.638B × 8% = $131 million
Worth flagging in a deck.
Investor slide framing: "Our addressable online market is $1.6B; with current channel reach, we're targeting $131M in near-term revenue opportunity."
Per the Amazon Ads TAM/SAM/SOM guide, the customer-count-times-average-spend approach used in Example B is the most straightforward method for consumer categories with available demographic data.
What if no market report exists for your category?
Category-defining products, the kind that create new behavior rather than replace an existing one, often have no analyst report to anchor a top-down estimate. The value-theory approach fills that gap.
TechCrunch's market-sizing guide recommends quantifying the measurable dollar value your product delivers per customer (cost savings, revenue lift, hours saved times an hourly rate), then multiplying by the number of customers who could realistically capture that value. That product becomes your TAM estimate.
How to apply it:
- Identify one concrete, measurable outcome your product delivers (e.g., "saves a 10-person team 5 hours per week at $50/hour average").
- Quantify the annual value per customer: 5 hours × 50 weeks × $50 = $12,500 per year.
- Estimate the population of customers who face that exact problem and could pay for the solution.
- TAM = value per customer × addressable population.
The hybrid version anchors this to real signals: adjacent category reports, pilot customer pricing, or early contract commitments. A signed LOI from a pilot customer at a specific price point is worth more in an investor conversation than any analyst estimate.
Value-theory TAM is only as credible as the customer value you can prove. Pilot data, signed contracts, and measurable outcomes from early users are the evidence that turns a theoretical number into a defensible one.
Pro Tip: Run a pricing experiment with 5–10 pilot customers before finalizing your value-theory TAM. What they actually pay, not what you model, is the number investors trust.
Common mistakes founders make and what investors actually look for
The most common credibility killer in a pitch deck isn't a small TAM. It's a TAM/SAM/SOM slide that doesn't hold together under five minutes of questioning.
Top founder mistakes:
- Quoting only TAM. A $10B TAM with no SAM or SOM tells an investor nothing about your plan. TechTarget's market-sizing definition flags this as one of the most common ways founders overreach.
- Mixing units. TAM in dollars, SAM in customers, SOM in units sold. Pick one unit and hold it.
- Unsupported capture rates. "We'll capture 20% of the market in year 3" with no sales capacity math behind it is a red flag, not a goal.
- No reconciliation between methods. Showing only a top-down number without a bottom-up check signals the founder hasn't stress-tested their own assumptions.
- Treating SAM as TAM. Applying one filter (geography) and calling the result TAM is a common error that inflates the headline number.
What investors want to see:
Investors prioritize a defensible SOM grounded in bottom-up inputs and sales capacity. A large TAM without a credible SOM is a red flag. FoundStep's market-sizing benchmarks show that VC investors typically want to see a TAM of at least $1 billion, while the SOM expectation scales with funding stage.
Pre-pitch investor checklist:
- Are TAM, SAM, and SOM all shown, with clear definitions for each?
- Is the primary method (top-down or bottom-up) documented with named data sources?
- Does a bottom-up check confirm the top-down number within a reasonable range?
- Is the SOM tied to actual sales capacity (reps, quota, close rate)?
- Are assumptions listed explicitly, not buried in footnotes?
- Is there a sensitivity range showing how SOM changes under different scenarios?
- Are units consistent throughout (all revenue or all customers)?
Where to find U.S. data inputs for your market-sizing model
The quality of your TAM/SAM/SOM is only as good as the inputs. Here are the sources that actually hold up in investor Q&A.
Primary U.S. government sources:
- U.S. Bureau of Labor Statistics (BLS): Best for employment counts by industry and occupation, earnings data, and workforce size. The BLS industry data is a concrete example of how granular these reports get — useful for building bottom-up counts in labor-intensive categories.
- U.S. Census Bureau: Best for household counts, demographic breakdowns, income bands, and business counts by size and industry (via the County Business Patterns and Economic Census datasets).
Analyst and industry sources:
- Gartner: Best for technology category revenue, market share by vendor, and enterprise spending forecasts. Expensive but widely cited and investor-recognized.
- IBISWorld: Best for industry-level revenue, growth rates, and competitive concentration in U.S. markets. More accessible than Gartner for early-stage founders.
- Statista: Good for quick consumer market data and cross-category benchmarks. Treat as a starting point, not a primary source.
Practical tools:
- Build a simple spreadsheet with three tabs: TAM inputs, SAM filters, and SOM assumptions. Keep every formula visible.
- Use the Deckary TAM/SAM/SOM calculator to sanity-check your numbers against common benchmark ranges.
- For identifying business opportunities and validating market demand before building a full model, Harvard Business School Online's framework offers a structured starting point.
- For B2B SaaS models, pull account-level data from your CRM or a B2B contact database to count reachable accounts directly rather than relying on analyst estimates.
Source-to-input matching:
- Use BLS for labor counts and workforce size inputs.
- Use U.S. Census for household and business count inputs.
- Use Gartner or IBISWorld for total industry revenue inputs (top-down TAM anchor).
- Use your own CRM and pipeline data for bottom-up SAM and SOM inputs.
Quick reference: formulas, units, and pitch-deck checklist
Core formulas:
- TAM (revenue): Total customers in market × Average annual revenue per customer
- TAM (customer units): Total potential buyers in your defined market
- SAM (revenue): TAM × Percentage of market your offering can serve
- SAM (customer units): Total TAM customers × Serviceable segment filter
- SOM (revenue): SAM × Realistic near-term capture rate
- SOM (customer units): SAM customers × Realistic win rate
Unit guidance:
- Use ARR or ACV for subscription SaaS products in investor presentations.
- Use one-time transaction value for consumer or transactional products.
- Use units per household for consumer packaged goods or retail.
- Switch to customer counts for operational planning, quota-setting, and sales development consulting capacity models.
Pitch-deck assumption checklist:
- Named data source for every top-down input (BLS, Census, Gartner, IBISWorld)
- Explicit ICP definition (company size, geography, industry, buyer role)
- ACV or ARPU with source (your own data preferred over benchmarks)
- SAM filter logic documented (which segments were removed and why)
- SOM tied to sales capacity (number of reps × annual quota × close rate)
- Sensitivity range for SOM (best case, base case, downside)
- Bottom-up check confirming top-down estimate within a reasonable range
These are starting points, not targets. Your SOM should be derived from your own capacity math, not picked from a benchmark range.
SOM vs. market share: they measure different things
Serviceable Obtainable Market and "market share" sound interchangeable. They aren't, and conflating them in a pitch creates confusion fast.
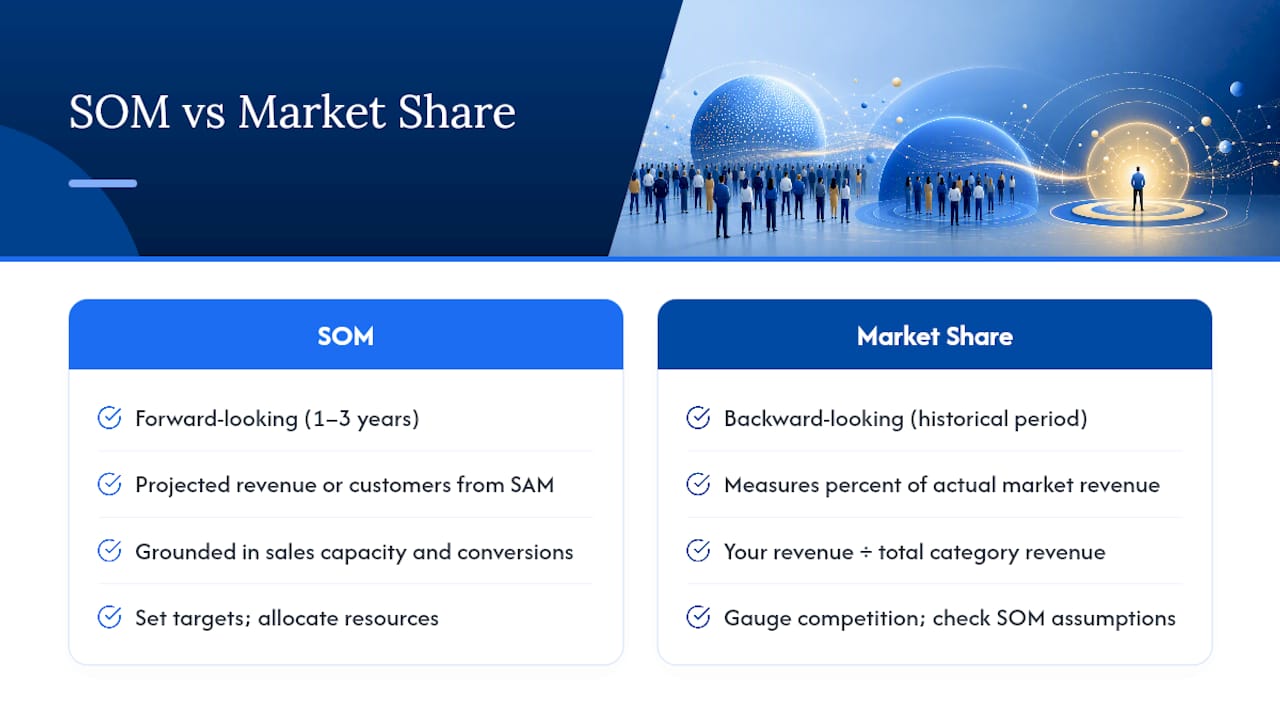
SOM is a forward-looking planning number. It represents the revenue or customer count you project capturing from your SAM over a defined near-term window, typically 1–3 years. It's an input to your financial model and go-to-market plan. The calculation is grounded in your sales capacity, channel reach, and conversion assumptions, not in what competitors currently hold.
Market share is a backward-looking competitive metric. It measures the percentage of actual market revenue or volume a company has already captured relative to all competitors. You calculate it after the fact: your revenue divided by total category revenue in a given period.
The practical distinction matters in two situations. First, when you're building a pitch deck, use SOM, not market share, because you don't have historical revenue to report yet. Second, in competitive analysis, market share tells you how concentrated the category is and how much room exists for a new entrant.
A useful rule: use SOM to set targets and allocate resources, use market share data to understand competitive intensity and validate whether your SOM assumptions are realistic.
How TAM, SAM, and SOM connect to your go-to-market plan
Market sizing that lives only in a pitch deck is wasted work. The real value comes when TAM, SAM, and SOM drive actual decisions about channels, hiring, and sequencing.
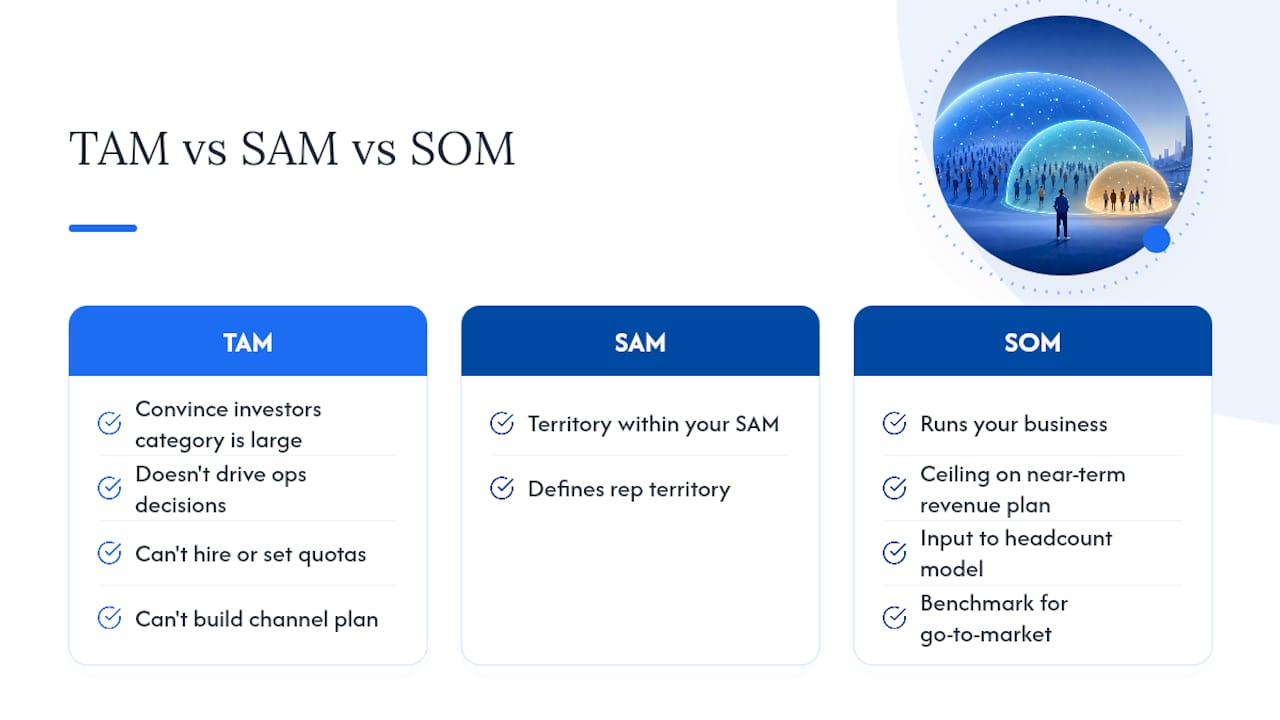
SAM defines your targeting universe. The filters you applied to get from TAM to SAM, geography, company size, buyer role, pricing tier, are exactly the parameters your sales and marketing teams should use to build their account lists and campaign targeting. If your SAM filter says "U.S. mid-market professional services firms," your ABM platform targeting should reflect that precisely.
SOM sets your near-term quota and hiring plan. If your SOM is $18M over three years and your average ACV is $12,000, you need to close 1,500 customers. Work backward from there to determine how many SDRs, AEs, and marketing-sourced leads you need per quarter. SOM without a capacity model is just a number; with one, it becomes a hiring plan.
TAM guides sequencing decisions. When you have multiple potential segments, TAM analysis by segment tells you which ones are worth pursuing first.
The connection between market sizing and sales execution is direct: your SOM should be the ceiling on your first-year sales plan, and your SAM should define the universe your sales development team works. When those numbers are aligned, your go-to-market plan and your financial model tell the same story, which is exactly what investors and operators both need to see.
Why SOM is the only number that actually runs your business
That's backwards.
TAM is useful for one thing: convincing investors the category is large enough to justify their return expectations. Beyond that conversation, it doesn't drive a single operational decision. You can't hire against TAM. You can't set a quota against TAM. You can't build a channel plan against TAM.
SOM is the number that runs your business. It's the ceiling on your near-term revenue plan, the input to your headcount model, and the benchmark against which you measure whether your go-to-market is working.
The discipline of building SOM from the bottom up, starting with sales capacity and working forward to revenue, rather than starting with a market figure and working backward to a percentage, changes how you think about growth. It forces the question: "Do we have enough reps, enough pipeline, and enough conversion rate to hit this number?" That question is more useful than any analyst report.
My advice after 25 years scaling sales teams at companies like RingCentral and Cisco-WebEx: tie your SOM to your first sales hire. If you can't explain how one rep, working a defined territory within your SAM, gets to a specific revenue number in year one, your SOM isn't a plan. It's a guess. Build the capacity model first, then let SOM follow from it. That's the version investors believe, and more importantly, it's the version that actually works.
For founders who want hands-on help connecting market sizing to sales execution and pipeline strategy, Chadburmeister covers consulting, speaking, and leadership engagements built around exactly this kind of GTM work. The books on AI for Sales and B2B lead generation go deeper on the execution side.
Sources
A short list of the most credible places to pull inputs and go deeper on market-sizing methodology:
- TAM, SAM, and SOM guide | HubSpot Blog
- How to calculate your startup's TAM, SAM, and SOM | TechCrunch
- Apparel data in fashion (BLS) | U.S. Bureau of Labor Statistics