
Your pipeline coverage ratio equals total open pipeline value divided by your revenue target for the same period. A team carrying open opportunities against a quarterly quota has coverage equal to the ratio of pipeline value to quota. The widely cited benchmark sits between a low and high multiple, but the principled target is the inverse of your win rate; for example, a team with a 25% win rate needs exactly 4x coverage before applying any buffer. According to HubSpot's definition, the 3x–5x heuristic holds only when your win rate hovers near 25–33%. Borrow someone else's benchmark without checking your own numbers and you are flying blind.
The number that actually matters: your required coverage = 1 ÷ your stage-weighted win rate, multiplied by a slippage buffer of 1.2x–1.3x.
Table of Contents
- How to calculate pipeline coverage ratio
- Weighted vs. unweighted coverage: which one should you use?
- How much coverage do you actually need?
- What your coverage ratio is actually telling you
- Pipeline coverage vs. forecast coverage: what is the difference?
- How often should you check pipeline coverage?
- How to move the ratio: a 30/60/90 playbook
- Segmentation and nuance: the RevOps view on coverage targets
- Key Takeaways
- Why most teams are solving the wrong pipeline problem
- Work with Chad Burmeister to fix your pipeline coverage
- Useful sources for going deeper
How to calculate pipeline coverage ratio
Step 1: Export and scope your opportunities
Pull every open opportunity with a close date inside your measurement period. Filter by segment, sales motion, and rep if you are building segment-level views (you should be).
Step 2: Choose unweighted or weighted coverage
Unweighted (raw) coverage sums the full deal value of every open opportunity and divides by target. It shows gross funnel supply. Weighted coverage multiplies each deal's value by its stage probability before summing, then divides by target. It estimates expected value. Metabase's coverage guide explains that weighted coverage is more realistic but only when stage probabilities reflect recent actual conversion rates, not CRM defaults set years ago.
Step 3: Run the raw calculation
Raw coverage = Σ(open deal value) ÷ revenue target
Step 4: Run the weighted calculation
Weighted coverage = Σ(deal value × stage probability) ÷ revenue target
Sample stage probability table:
| Stage | Typical probability | Notes |
|---|---|---|
| Stage 1: Prospecting | 10% | Rarely counts toward current-quarter coverage |
| Stage 2: Discovery | 20% | Include only if close date is current period |
| Stage 3: Solution/Demo | — | Core coverage stage for most teams |
| Stage 4: Proposal/Evaluation | 60% | High-confidence; validate against actual close rate |
| Stage 5: Negotiation/Verbal | — | Should be in forecast, not just coverage |
| Stage 6: Closed Won | — | Already booked; exclude from open pipeline |
Three worked examples
Transactional motion (SMB, 30-day cycle):
- Open pipeline: $800K across 40 deals
- Monthly quota: $250K
- Raw coverage: $800K ÷ $250K = 3.2x
- Weighted coverage (applying stage probabilities): ~$280K ÷ $250K = 1.1x
- Diagnosis: raw looks fine; weighted reveals most deals are early-stage. Acceleration needed.
Mid-market motion (90-day cycle):
- Open pipeline: $4.5M across 18 deals
- Quarterly quota: $1.2M
- Raw coverage: $4.5M ÷ $1.2M = 3.75x
- Weighted coverage: ~$1.8M ÷ $1.2M = 1.5x
- Diagnosis: healthy weighted coverage; monitor for deal concentration risk.
Enterprise motion (180-day+ cycle):
- Open pipeline: $12M across 6 deals
- Quarterly quota: $2M
- Raw coverage: $12M ÷ $2M = 6x
- Weighted coverage: ~$3.2M ÷ $2M = 1.6x
- Diagnosis: high raw coverage but only 6 deals. One loss drops coverage significantly. Needs more deals, not just more value.
Audit checklist before you publish the number
A disciplined audit uses three flags per opportunity: recent buyer interaction (within the last 30 days), an identified economic buyer, and a documented next step with a calendar date. SalesTap's pipeline audit framework recommends treating any deal missing two or more of those flags as not counting toward coverage. Run this filter before presenting your ratio to leadership.
Pro Tip: Before your next pipeline review, tag every deal in your CRM with a simple red/yellow/green flag based on those three criteria. The deals that turn red are not pipeline. Strip them out first, then calculate.
Weighted vs. unweighted coverage: which one should you use?
Both numbers belong in your toolkit. The question is which one you lead with and when.
| Dimension | Raw (unweighted) coverage | Weighted coverage |
|---|---|---|
| What it shows | Gross funnel supply | Expected value based on stage |
| Best use case | Capacity planning, demand-gen decisions | Forecast confidence, exec reporting |
| Main risk | Overstates confidence if pipeline is early-stage | Hides bad assumptions if probabilities are stale |
| Transparency | High — easy to audit | Lower — depends on probability accuracy |
| When to prefer it | Early in the quarter, pipeline creation reviews | Late in the quarter, forecast calls |
Raw coverage is honest about volume. Weighted coverage is honest about quality — but only if your stage probabilities are calibrated against real historical conversion data, not CRM defaults. Many teams set Stage 4 at 60% when their actual close rate from that stage is 38%. That gap makes weighted coverage look better than reality.
Pro Tip: Quarterly, pull your last four quarters of closed-won and closed-lost data. Calculate the actual conversion rate from each stage to close. If those numbers differ from your CRM probabilities by more than 10 percentage points, update the probabilities before running weighted coverage.
Present both numbers side by side. If raw coverage is 4x and weighted is 1.2x, you have a stage-mix problem. If both are above 2x, you have a quality pipeline. The gap between them is the signal.
How much coverage do you actually need?
The 3x rule originated when B2B win rates commonly sat around 33%. Lative's analysis points out that with modern average win rates closer to 21% in some datasets, a mathematically correct target trends toward 4.8x before any slippage buffer. Borrowing 3x when your win rate is 20% leaves you structurally short every quarter.
The principled approach:
- Apply a slippage buffer: PulseRevOps recommends adding 1.2x–1.3x on top of the base to account for deal pushes, scope shrinkage, and procurement delays. At 4x base, your working target becomes 4.8x–5.2x.
Motion-specific guidance:
- Transactional/SMB: 3x–4x is often sufficient. Short cycles mean you can create pipeline and close it within the same quarter. Sales development consulting for high-velocity teams focuses on volume and speed, not just ratio size.
Coverage target formula: Required coverage ≈ (1 ÷ stage-weighted win rate) × hygiene/confidence factor × slippage buffer (1.2x–1.3x)
What your coverage ratio is actually telling you
A number without context is noise. Here is how to read the signals:
High coverage, low win rate: you have volume but not quality. Deals are entering the funnel but not converting. The fix is qualification tightening, not more prospecting.
Low coverage, high win rate: your pipeline is efficient but thin. One bad month of prospecting and you miss the quarter. The fix is demand generation and top-of-funnel investment now, because coverage today maps to revenue one full sales cycle later.
High stage aging: deals sitting in Stage 3 for 90+ days in a 60-day average cycle are not pipeline. They are wishful thinking. Audit them or remove them.
Segment mismatches: your overall ratio looks fine but your enterprise segment is at 2x while SMB is at 6x. The aggregate hides the risk. This is exactly why Rework's RevOps framework insists on segmented views.
Next-step checklist when coverage signals a problem:
- Audit stale deals (no activity in 75+ days) and remove or re-qualify them.
- Reassign resources from over-covered segments to under-covered ones.
- Accelerate late-stage deals with executive sponsorship or pricing incentives.
- Trigger demand-gen campaigns if coverage is below target with more than 45 days left in the quarter.
- Reset forecast confidence if weighted coverage drops below 1.5x.
Pipeline coverage vs. forecast coverage: what is the difference?
These two metrics answer different questions. Conflating them is one of the most common errors in exec reporting.
Pipeline coverage counts all open opportunities scoped to the period, regardless of commit status. It answers: "Do we have enough raw material to hit the number?"
Forecast coverage counts only committed and best-case opportunities. It answers: "What is our probable outcome based on what reps are willing to stand behind?"
When to use each:
- Use pipeline coverage as a leading indicator early in the quarter to spot creation gaps before they become forecast problems.
- Use forecast coverage for committed guidance to leadership and board-level reporting.
- Present both numbers together with stage mix and deal aging to reduce end-of-quarter surprises. An AI-assisted forecasting approach can automate this side-by-side view and flag divergence automatically.
Presentation tip for leadership: show pipeline coverage, forecast coverage, and the gap between them. A large gap (say, 5x pipeline but only 1.3x forecast) signals that reps are not committing to deals they have in the funnel. That is a qualification or confidence problem, not a volume problem.
How often should you check pipeline coverage?
Coverage is a leading indicator, which means it only works as an early warning if you check it before the quarter is over. Outsales recommends weekly tracking at minimum so that movement signals are visible while you still have time to act.
Weekly checks (current-period risk):
- Close-date movement (deals pushed out of the quarter)
- Stage aging (deals stalled for more than two weeks with no activity)
- Stale deals (no buyer interaction in 30+ days)
- Week-over-week coverage change (is the ratio growing or shrinking?)
Monthly reviews (trend and source analysis):
- Source mix (inbound vs. outbound vs. partner vs. renewal)
- Segment performance (which motions are under-covered?)
- Conversion trends by stage (are probabilities still accurate?)
- Rep-level coverage to spot individual gaps early
Quarterly planning (target reset):
- Recalculate required coverage using updated win-rate data
- Adjust capacity plans based on coverage gaps
- Set demand-gen investment levels for the next quarter
- Review hygiene rules and update stage probabilities
The weekly check is the one most teams skip. They look at coverage in the last two weeks of the quarter when it is too late to do anything about a gap. Set a standing 30-minute weekly pipeline review and track coverage movement as a chart, not just a snapshot.
How to move the ratio: a 30/60/90 playbook
Next 30 days: hygiene and acceleration
The fastest way to improve coverage is to make it accurate first. Strip zombie deals (no activity in 75+ days, per Fairview's hygiene guidance), then work what remains.
- Run the three-flag audit on every open deal in the current period.
- Remove or re-qualify any deal missing two or more flags.
- Identify the top 20% of deals by value and assign executive sponsors.
- Send re-engagement sequences to deals stalled in Stage 2–3 for more than 30 days.
- Update close dates to reflect reality, not optimism.
30–60 days: targeted prospecting and qualification
- Launch outbound sequences targeting the ICP segments where coverage is thinnest.
- Activate partner and channel plays for deals that need a third-party nudge.
- Pull renewal and expansion opportunities into the current-period view if they are genuinely closable.
- Tighten qualification criteria: require a documented economic buyer and a mutual close plan before a deal advances past Stage 2.
- Use a quality B2B contact database to fuel outbound in under-covered segments.
Pro Tip: Track week-over-week coverage movement as a percentage change, not just the absolute ratio. A ratio dropping from 4.2x to 3.8x in one week is a signal worth investigating even if 3.8x still looks "fine."
60–90 days: capacity and funnel investment
- Evaluate whether coverage gaps are structural (not enough reps, wrong territory design) or tactical (poor prospecting habits).
- Make capacity hire decisions based on projected coverage shortfall, not just quota attainment.
- Rebalance territories if one segment is chronically over-covered while another is starved.
- Invest in demand-gen campaigns that will produce pipeline for the next quarter's coverage, not this one.
- Set CRM confidence flags and automate weekly coverage reports so the number is visible without manual effort.
Segmentation and nuance: the RevOps view on coverage targets
A single static coverage target for the whole company is a shortcut that creates blind spots. The right approach is to derive a target for each meaningful segment, then validate it against real data.
-
Calculate stage-weighted win rate by segment. Pull closed-won and closed-lost data for the last four quarters. For each segment (SMB, mid-market, enterprise), calculate the percentage of Stage 1 entries that became closed-won. That is your true win rate for that motion.
-
Apply the hygiene/confidence factor. Before computing coverage, strip deals that fail your audit criteria. A hygiene factor of 0.8–0.9 is common, meaning you assume 10–20% of what looks like pipeline will not close for non-deal reasons (rep leaves, deal goes dark, budget pulled).
-
Derive required coverage per segment. Required coverage = (1 ÷ segment win rate) × (1 ÷ hygiene factor) × slippage buffer. For an enterprise segment with a 15% win rate, a 0.85 hygiene factor, and a 1.25 slippage buffer: (1 ÷ 0.15) × (1 ÷ 0.85) × 1.25 ≈ 9.8x. That number surprises most managers. It should.
-
Set audit rules and enforce them. Fairview's pipeline hygiene framework recommends removing any deal with no buyer activity in 75+ days or with a close date already past. Require a documented next step with a calendar date for any deal to count toward current-period coverage.
-
Increase the slippage buffer for long procurement cycles. PulseRevOps advises that deals with high stakeholder counts, formal procurement processes, or legal review stages need a buffer closer to 1.3x–1.4x. A deal that takes six months to close has more opportunities to slip than one that closes in 30 days.
-
Link coverage targets to the four capacity levers: volume (how many deals enter the funnel), conversion (win rate by stage), velocity (how fast deals move), and average selling price. Lative's capacity-planning framework treats coverage as an output of these four inputs, not a standalone target. If your win rate improves, your required coverage drops. If your ASP rises, you need fewer deals to hit the same quota.
Segment-target examples:
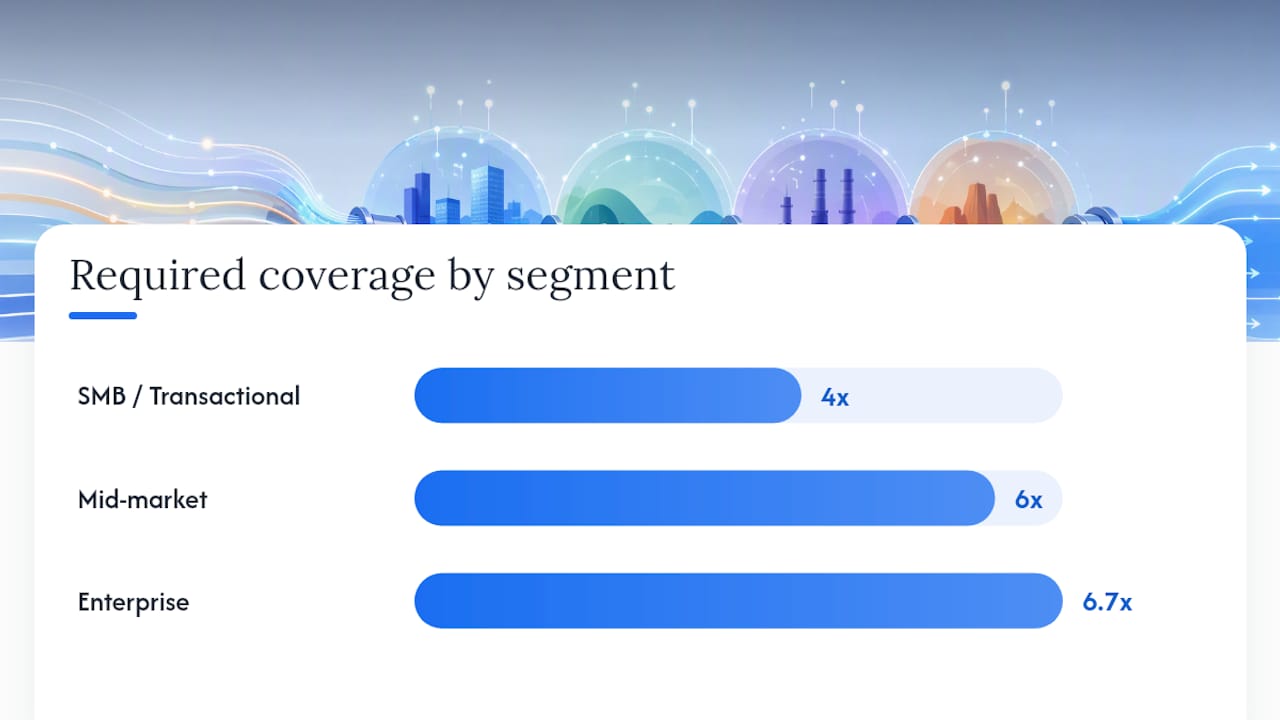
| Segment | Win rate | Hygiene factor | Slippage buffer | Required coverage |
|---|---|---|---|---|
| SMB/Transactional | 30% | — | 1.2x | 4x |
| Mid-market | 21% | 0.85 | 1.25 | 6x |
| Enterprise | 15% | — | 1.3x | 6.7x |
These are illustrative targets built from the formula above. Your numbers will differ. The point is to derive them from your own data rather than borrowing a generic multiplier.
Key Takeaways
A defensible pipeline coverage ratio requires segmented targets derived from your own win rates, strict hygiene rules, and a weekly inspection cadence — not a borrowed 3x benchmark.
| Point | Details |
|---|---|
| Use the principled formula | Required coverage = (1 ÷ win rate) × hygiene factor × slippage buffer of 1.2x–1.3x. |
| Segment before you calculate | Break coverage by motion, rep, and source; aggregate ratios hide segment-level risk. |
| Run the three-flag audit | Strip deals missing buyer interaction, economic buyer, or a documented next step before reporting coverage. |
| Check weekly, not quarterly | Coverage is a leading indicator; a ratio dropping mid-quarter signals a shortfall one full cycle later. |
| Chadburmeister's approach | Chad Burmeister's pipeline audit and 30/60/90 playbook help teams derive and operationalize defensible coverage targets. |
Why most teams are solving the wrong pipeline problem
The coverage ratio conversation almost always starts in the wrong place. Teams obsess over whether the number is above 3x when the real question is whether the number is real. In my experience working with sales organizations across companies like RingCentral and Cisco-WebEx, the single most common problem is not insufficient pipeline. It is pipeline that looks sufficient on paper but collapses under a basic hygiene audit.
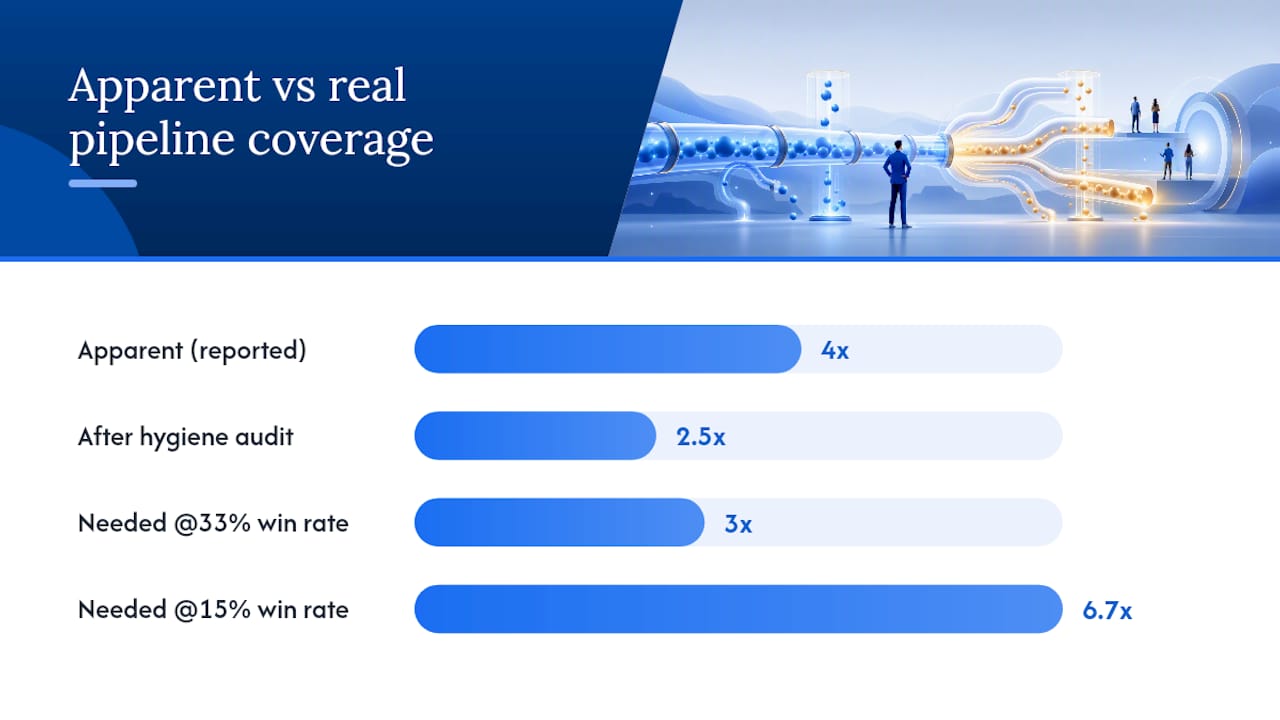
Strip out the zombie deals, the opportunities with no buyer activity in 75 days, the deals with close dates that have already passed, and the ones where nobody can name the economic buyer. In many CRMs, that audit removes 30–40% of what was being counted as coverage. Suddenly a team at 4x is actually at 2.5x, and the quarter's outcome was already determined weeks ago.
The second thing most guides get wrong is treating coverage as a company-wide number. A 4x aggregate that hides a 1.8x enterprise segment is not a healthy pipeline. It is a false sense of security. The only version of this metric that actually helps you manage is the segmented one, broken down by motion, rep, source, and stage.
The third thing: the 3x rule is a relic. It made sense when B2B win rates were commonly around 33%. For many teams today, especially in enterprise and complex sales, win rates are closer to 15–20%. At 15%, you need exactly 6.7x coverage before any slippage buffer. Nobody talks about that number because it is uncomfortable. But it is the honest math.
The teams that consistently hit quota are not the ones with the highest pipeline ratios. They are the ones who know exactly what their real pipeline is, check it every week, and act on gaps before the quarter is over.
Work with Chad Burmeister to fix your pipeline coverage
If your team's coverage ratio looks fine on paper but the quarter keeps coming up short, the gap is almost always in the audit, the segmentation, or the cadence. Chad Burmeister works directly with sales leaders to run a structured pipeline audit, validate stage probabilities against real historical data, and build a 30/60/90 playbook your team can execute without a six-month consulting engagement.
Engagements range from a focused pipeline audit and coverage model build to full SDR/BDR leadership, workshops for revenue teams, and the Be Extraordinary curriculum for managers who want a structured program. Every engagement starts with the numbers, not a framework deck.
Schedule a pipeline audit with Chad and walk away with a defensible coverage target, a hygiene checklist your team can run weekly, and a clear picture of where your quarter is actually headed.
Useful sources for going deeper
- Pipeline Coverage Ratio: How Much Pipeline Do You Need?
- Sales Pipeline Coverage — Definition, FAQs & How ...
- Pipeline Coverage: Definition, Formula & How to Track It in Metabase
- What is Pipeline Coverage: Why 3x Isn't the Answer and How to Build the Number That Is | Lative
- Pipeline Coverage: Definition, Formula & the Right Ratio | Outsales
- Pipeline Coverage Ratios: 3x, 4x, 5x Explained | SalesTap