Three numbers matter more than the other forty you're probably tracking: meeting-to-opportunity rate, meetings held (not just booked), and pipeline generated per SDR. Everything else is either a coaching input or noise. Activity metrics like dials and emails sent tell you what a rep is doing; outcome metrics tell you whether it's working. Benchmarks for both are moving in 2026, and the gap between median and top-quartile performers has never been wider.
TL;DR:
- Meeting-to-opportunity rate, meetings held, and pipeline generated per SDR are the most critical metrics for evaluating performance and guiding coaching.
- Benchmarks for 2026 show median meetings per SDR range from 25 to 40 monthly, with top-quartile SDRs surpassing a 9% connect rate and generating $5 million to $8 million in pipeline annually.
- Effective scorecards must include clear definitions, controlled denominators, assigned owners, review timelines, and actionable decisions to be useful management tools.
- Targets should be based on internal baseline data, adjusted for ICP, ACV, and market shifts, and reviewed quarterly to remain realistic and motivating.
- Focusing on a small set of precise, outcome-oriented KPIs and connecting them to CRM and engagement tools enhances trust, clarity, and impact on revenue.
Table of Contents
- SDR KPIs: The Three Tiers That Separate Coaching From Evaluation
- 2026 Benchmarks: What Median and Top-Quartile SDRs Actually Hit
- Building a Fair SDR Scorecard: Definitions, Owners, and Review Cadence
- Setting SDR KPI Targets From Your Own Baseline
- Five Measurement Mistakes That Wreck SDR Visibility
- Chad's Practitioner Playbook: Calibration and Onboarding Checks
- How SDR KPIs Connect to the Revenue Number Leadership Actually Cares About
- What Aggressive KPI Tracking Does to SDR Morale
- Reading KPI Trends Into Real Decisions
- Connecting SDR KPIs to Your CRM and Sales Engagement Stack
- Adjusting SDR KPIs When Ramp or the Market Shifts
- Why Fewer, Well-Defined KPIs Beat Long Dashboards
- How Chad Burmeister Helps Teams Fix Broken SDR Scorecards
- Where the 2026 Benchmarks in This Article Come From
- Sources
SDR KPIs: The Three Tiers That Separate Coaching From Evaluation
Every SDR metric falls into one of three buckets, and mixing them up is the single biggest reason scorecards fail. Activity metrics are leading indicators: dials made, emails sent, sequences started, LinkedIn touches logged. They tell you volume, nothing more. A rep can hit every activity number and still produce zero pipeline if the list is bad or the messaging is off.
Efficiency metrics sit in the middle. Connect rate, conversation-to-meeting ratio, and email reply rate measure how well raw activity converts into something useful. These are quality checks, not scoreboards.
Outcome metrics are what leadership actually cares about: meetings held, meeting-to-opportunity conversion, and pipeline generated. Leadium's research on pipeline-predictive metrics identifies five numbers that consistently forecast pipeline: connect rate, conversations per qualified meeting, meeting-held rate, meeting-to-opportunity conversion, and cost per qualified meeting.
The taxonomy that matters most for fairness is "who controls it":
- Rep-controlled: call quality, discovery questions asked, follow-up cadence
- List-controlled: contact accuracy, phone/email validity, ICP fit
- Infrastructure-controlled: dialer uptime, email deliverability, CRM data sync
Judge a rep on rep-controlled numbers. Judge your ops team on the rest. Denominators decide whether a rate is honest. "Connect rate" means nothing until you know if it's connects divided by dials attempted, dials answered, or unique accounts called. Define the denominator before you argue about the number.
2026 Benchmarks: What Median and Top-Quartile SDRs Actually Hit
Aggregated benchmark data shows a median meetings set per SDR per month, with top-quartile reps hitting a higher range, according to Alba Talent's 2026 SDR benchmark report. Inbound-heavy teams run higher, often 25 to 40 meetings, because the lead is already warm. Enterprise and ABM motions run lower by design. Fewer, bigger accounts mean fewer meetings but heavier pipeline value per meeting.
2026 benchmark snapshot: Median connect rate sits near 6.1%, with a typical range of 3% to 10% depending on list quality and vertical. Top-quartile SDRs push past 9%. Cold email reply rates run 1% to 3% for generic sequences, but personalized, researched outreach can clear 5%. Replies that follow a voicemail tend to land even higher, since the prospect already has context.
Pipeline generation is where the real separation shows up. The median B2B SaaS SDR generates roughly $3 million in pipeline per year, while top performers in Skipcall's benchmark analysis generate $5 million to $8 million. That's not a small gap. It usually traces back to list quality and meeting-to-opportunity conversion rather than raw call volume.
Ramp time and cost benchmarks round out the picture:
- Median ramp time: approximately 3.9 months to full productivity
- Fully loaded annual cost: around $134,000 per SDR when you include base, variable comp, tools, and management overhead
- Cost per qualified meeting: varies widely by ACV and channel, but should trend down as ramp progresses
One warning worth repeating: Alba Talent's data also shows that connect rate and reply rates vary sharply by list quality and vertical. Always state the denominator next to the benchmark, or the comparison is meaningless.
Building a Fair SDR Scorecard: Definitions, Owners, and Review Cadence
A scorecard only works if every metric has five things attached to it: a precise definition, a denominator, an owner, a review cadence and a decision it triggers. Skip any of those five and the number becomes a talking point instead of a management tool, an approach RevenueFlow's breakdown of rep-controlled metrics argues convincingly.
Start by separating the meeting funnel into distinct stages instead of lumping them together:
- Booked: a meeting scheduled on the calendar, no show guarantee
- Held: the prospect actually showed up
- Accepted: the AE agreed the meeting was legitimate and worth a follow-up
- Qualified: the meeting produced a real opportunity with budget, authority, need, and timeline signals
A rep who books 20 meetings but only holds 12 and gets 6 accepted isn't performing at "20 meetings" level. They're performing at 6.
Here's a copy-ready scorecard structure you can paste straight into a spreadsheet:
| Metric | Definition (denominator) | Owner | Cadence |
|---|---|---|---|
| Connect rate | Live conversations ÷ dials attempted | Rep | Weekly |
| Meeting-held rate | Meetings held ÷ meetings booked | Rep | Weekly |
| Meeting→opportunity rate | Opportunities created ÷ meetings held | Rep + AE | Monthly |
| Pipeline generated | Total qualified pipeline value ÷ SDR | Manager | Monthly |
| Cost per qualified meeting | Fully loaded cost ÷ qualified meetings | Manager | Quarterly |
Weekly reviews belong to activity and efficiency metrics, the ones a rep can adjust day to day. Monthly reviews belong to outcome metrics, since pipeline takes weeks to materialize. Quarterly reviews belong to the money layer: cost per meeting, ramp progress, and comp attainment.
Setting SDR KPI Targets From Your Own Baseline
Industry benchmarks are a sanity check, not a starting point. Build targets from your own conversion chain first, then use published numbers, including Skipcall's benchmark set, to see whether your baseline is competitive.
- Pull 3 to 6 months of internal data. Calculate your actual dial-to-meeting and meeting-to-opportunity conversion rates. Don't estimate. Pull the real numbers from your CRM.
- Set three phased targets. A ramp target for months one through three, a steady-state target for the fully ramped rep, and a stretch target tied to top-quartile benchmarks.
- Adjust one lever at a time. If connect rate is the bottleneck, don't also change the meeting-to-opportunity target in the same quarter. You won't know which change caused which result.
- Factor in ICP and ACV. A rep selling into enterprise accounts with a 9-month sales cycle should never be judged against inbound-motion meeting counts.
- Tie targets to comp deliberately. Comp should reward the metric the rep actually controls, not a downstream number influenced by marketing lead flow or AE close rates.
Check list quality first. A cleaner, better-matched list often fixes the number faster than volume ever will, and your SDR compensation plan should reflect that priority.*
Five Measurement Mistakes That Wreck SDR Visibility
Most broken scorecards share the same handful of errors:
- Grading reps on deliverability or bounce rate, which belong on an infrastructure review, not a rep review.
- Counting autoresponders and out-of-office replies as positive engagement, inflating reply rate for no real reason.
- Treating dial count as a performance metric instead of a coaching input tied to connect rate.
- Quoting external benchmarks without checking your own denominator first.
- Tracking 15+ metrics when 5 to 7 would actually get reviewed and acted on.
Fix these five and most scorecards become usable within a single review cycle.
Chad's Practitioner Playbook: Calibration and Onboarding Checks
The diagnostic flow that exposes a stalled SDR fastest runs in one direction: accounts worked, then connect rate, then meetings held, then meeting-to-opportunity. Accounts worked, meaning distinct accounts that received genuine researched contact rather than a blast touch, is a more honest activity number than raw touches. The gap between the two often hides a rep who looks busy but isn't actually prospecting.
Use these in weekly 1:1s:
- "Walk me through the last account you worked. What did you know before you called?"
- "Which of your last 10 dials turned into a real conversation, and what happened after?"
- "Show me the meeting that didn't get accepted. What was missing?"
Pro Tip: Ask for evidence, not summaries. A rep who can pull up the actual call notes is coachable. A rep who can only recite their own numbers usually isn't tracking the right things.
A one-page onboarding checklist during ramp should track accounts worked, connect rate, and meetings booked weekly, nothing heavier. Save the full onboarding template for structuring the first 90 days properly, and pair it with a sales skills assessment before the rep even starts dialing.
How SDR KPIs Connect to the Revenue Number Leadership Actually Cares About
A KPI that doesn't trace to revenue is a vanity metric wearing a business suit. The chain runs: activity drives connects, connects drive meetings, meetings drive opportunities, opportunities drive closed revenue. If pipeline generated per SDR isn't moving the company's overall pipeline coverage ratio, something in that chain is broken, and it's usually not the SDR's fault. It's often a mismatched ICP or an AE team that isn't converting accepted meetings.
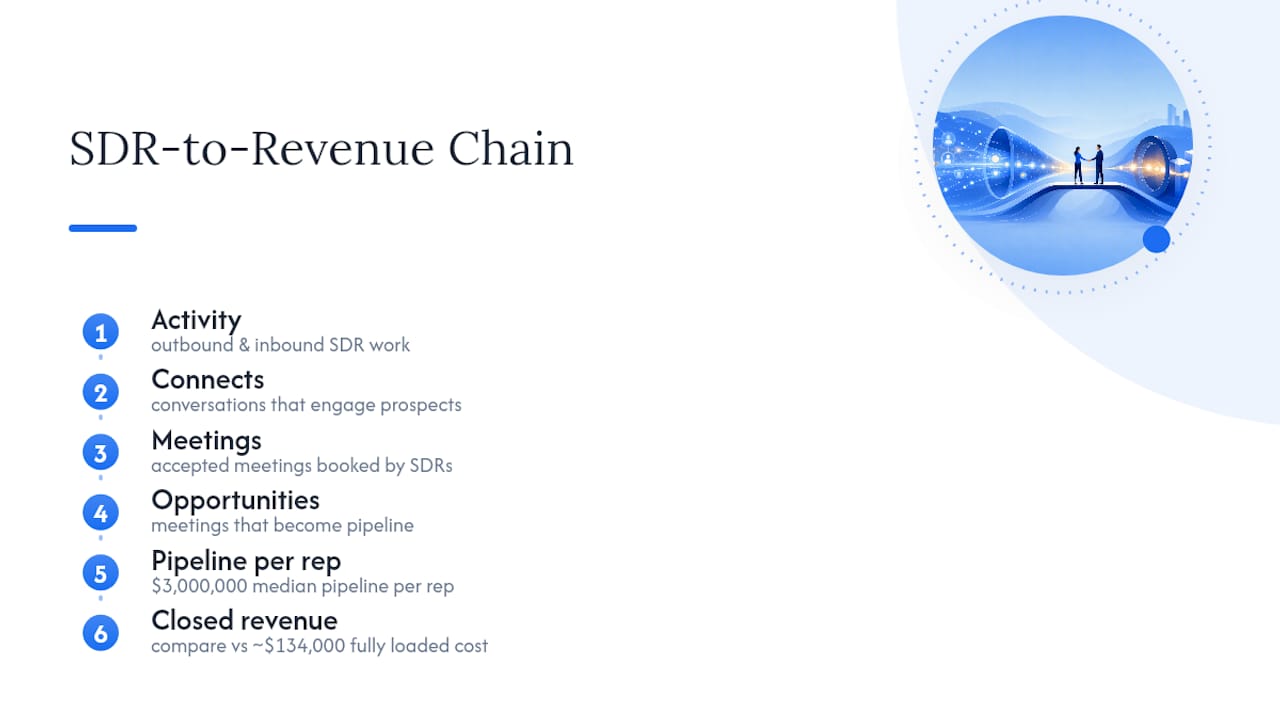
Revenue leaders should ask SDR managers one question every quarter: what percentage of company pipeline came from SDR-sourced meetings versus inbound or partner channels? That number tells you whether the SDR function is pulling its weight relative to its cost. A team generating $3 million in median pipeline per rep against a fully loaded cost of roughly $134,000 is producing strong return, assuming the pipeline actually converts downstream.
The disconnect happens when sales leadership sets SDR targets in isolation from AE capacity or close rates. If AEs can't work the volume of accepted meetings SDRs are producing, more meetings won't help revenue at all. It'll just create a backlog and frustrate everyone. Align SDR outcome targets to AE capacity and historical close rates before you set the number, not after you miss it.
What Aggressive KPI Tracking Does to SDR Morale
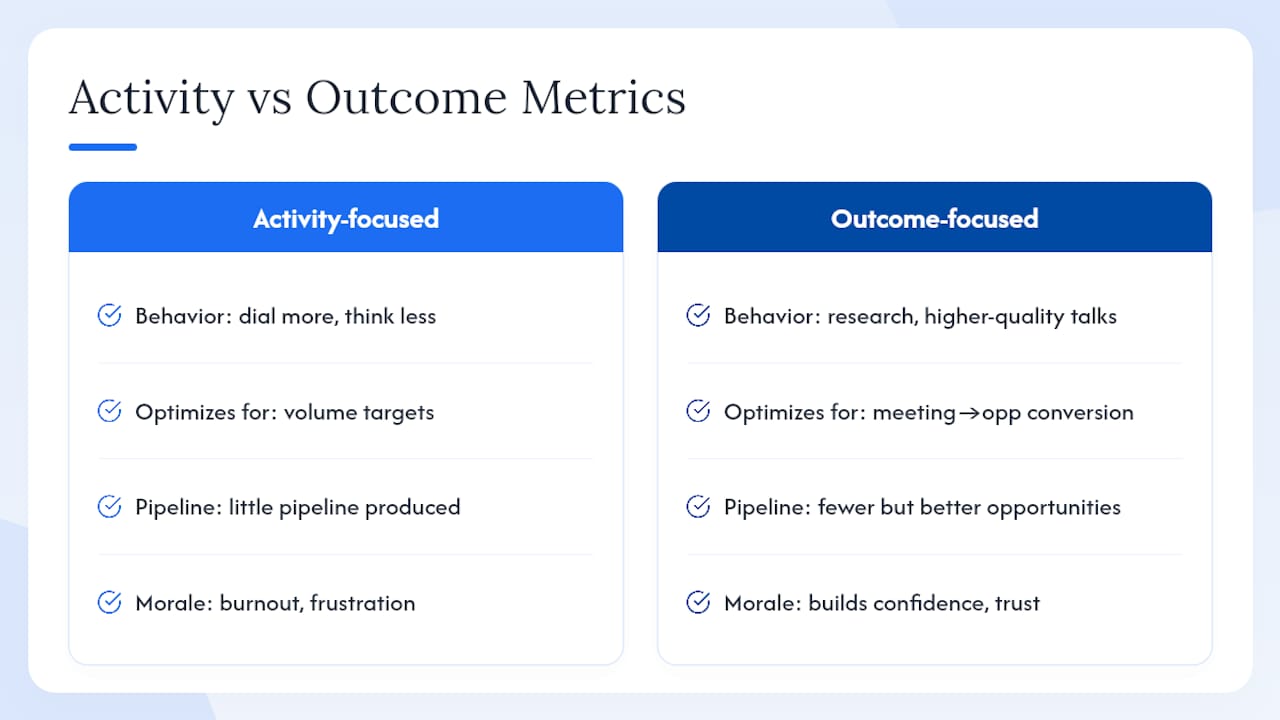
Metrics shape behavior whether you intend them to or not. A team measured purely on dial count will dial more and think less. A team measured on meeting-to-opportunity conversion will slow down, research harder, and have fewer but better conversations. The metric you spotlight is the behavior you're training.
Overloading a scorecard with activity numbers alone tends to produce burnout without producing pipeline, because reps optimize for the number in front of them, not the outcome behind it. Reps who hit dial targets but miss pipeline targets report the same frustration repeatedly: they did what was asked and still got dinged in the review. That disconnect erodes trust in the scorecard faster than almost anything else.
Outcome-based recognition, by contrast, tends to build confidence because it rewards judgment, not just volume. A rep who books fewer meetings but a higher share of them convert to opportunities should be recognized ahead of a rep with double the meeting count and half the conversion. Make that visible in team reviews, not just in the compensation formula.
The fix isn't to abandon activity tracking. It's to frame it correctly in every conversation: activity numbers are inputs you coach, not achievements you celebrate. Save the recognition, the leaderboard spot, and the bonus conversation for the outcome layer.
Reading KPI Trends Into Real Decisions
A benchmark only earns its keep when it changes what you do next week. Reps are booking meetings that prospects don't actually value enough to show up for.
If connect rate holds steady but meeting-to-opportunity conversion drops, the issue usually isn't outreach volume. It's what happens once a rep gets someone on the phone. That points to a coaching conversation about discovery questions, not a push for more dials.
A rising cost-per-qualified-meeting number over two consecutive quarters, even while meeting volume stays flat, usually signals that list quality is degrading or the ICP has drifted. Catching that trend three months earlier than a quarterly business review would have saved real budget and real ramp time on a hire who was never going to succeed against a decaying list.
Connecting SDR KPIs to Your CRM and Sales Engagement Stack
None of this works if your numbers live in three disconnected tools. Connect rate needs to pull automatically from your dialer or sales engagement platform. Meeting-held and meeting-to-opportunity rates need to sync from your CRM's opportunity stage history, not a manually updated spreadsheet someone forgets to touch after week two.
The practical setup: sales engagement platforms should feed activity and efficiency metrics (dials, connects, replies) directly into a reporting layer. Your CRM should own the outcome layer (meetings held, opportunities created, pipeline value) because that's where the AE and revenue data already lives. Trying to make either tool do the other's job creates duplicate, conflicting numbers that nobody trusts.
Automated reporting also solves the reply-rate hygiene problem directly. Build a filter that strips autoresponders and out-of-office replies before they hit the dashboard, rather than relying on a rep to self-report a clean number. A quality contact database feeding your sequences reduces the manual cleanup even further, since fewer bad numbers means fewer false positives showing up as replies in the first place.
Adjusting SDR KPIs When Ramp or the Market Shifts
Targets set in January rarely survive an ICP change, a pricing shift, or a new competitor eating into reply rates by summer. Treat KPI targets as living numbers, reviewed quarterly at minimum, not annual constants.
During ramp, lower the bar deliberately and track leading indicators more closely than lagging ones. A rep in month one should be judged on accounts worked and connect rate, not pipeline generated, because pipeline takes months to show up regardless of effort quality. Holding a new hire to steady-state pipeline targets in their first 60 days just teaches them to game activity numbers instead of learning the motion properly.
When the market shifts, whether it's a new competitor, an economic contraction, or a category-wide message that stops resonating, connect and reply rates usually move first. That's your early warning system. If connect rate drops 2 points across the entire team in the same month, it's not five individual coaching problems. It's a list, messaging, or market issue that needs a team-wide fix, not five separate performance conversations.
Why Fewer, Well-Defined KPIs Beat Long Dashboards
Most SDR dashboards fail from excess, not absence. Twenty metrics updated weekly produce less clarity than three tracked consistently: meeting-to-opportunity rate, meetings held, and pipeline generated per rep. Everything else, dials, emails, sequences started, belongs in the coaching conversation, not the scoreboard.
Precise denominators matter more than precise-sounding numbers. A connect rate without a stated denominator is a guess dressed up as data. Build the review cadence around that discipline: weekly for what a rep controls day to day, monthly for outcomes, quarterly for cost and ramp.
Treat published benchmarks as a mirror, not a mandate. They tell you whether your baseline is competitive. They should never replace the baseline you calculate from your own team's numbers first.
— Chad
How Chad Burmeister Helps Teams Fix Broken SDR Scorecards
Building the scorecard is the easy part. Getting a team to trust it, use it in weekly reviews, and actually change behavior because of it takes hands-on leadership, and that's where most internal efforts stall out. Experienced sales leadership and consulting engagements include executive sales leadership placements, AI-powered consulting for pipeline growth, and workshops built specifically around metric definitions, denominators, and coaching cadence.
If your team's KPI reviews feel more like arguments over definitions than actual coaching sessions, that's a fixable problem, not a permanent one. Visit Chadburmeister to book a consulting engagement or workshop and get a scorecard your team will actually trust in the next review cycle.
Where the 2026 Benchmarks in This Article Come From
Alba Talent's 2026 SDR benchmark report covers 47 metrics across meetings, connect rate, and ramp. Skipcall's pipeline-predictive KPI guide covers pipeline-per-rep figures. Leadium's metric framework and SalesHive's KPI glossary cover definitions and predictive metric selection.
Sources
- SDR Benchmarks 2026: 47 Metrics for B2B SaaS | Alba Talent
- SDR Metrics & KPIs: 12 Benchmarks That Predict Pipeline (Skipcall)
- SDR Metrics That Predict Pipeline (Leadium)