
Copy this sales QBR template, fill in the six sections with your account or team data, and send it 48 hours before the meeting. What follows is a plain-text template ready for a slide deck, a doc, or a CRM record, a slide-by-slide deck structure, KPI benchmarks, and a facilitation playbook built for sales managers who need the meeting to end with named owners, dates, and a booked next quarterly business review.
TL;DR:
- Successful QBRs require clear account data, with the next review scheduled before the current one ends to maintain ongoing accountability.
- Attendees should be limited to essential stakeholders, including decision makers, key users, and the account owner, to promote candid discussion.
- Visualizing metrics as trend lines against benchmarks, rather than static figures, enhances understanding and drives decision-making.
- Preparing data in advance and assigning slide ownership ensures the meeting results in commitments, not just status updates.
- Customization of the template based on industry, sales model, and account type maximizes relevance and effectiveness of the review process.
Table of Contents
- Sales QBR Template You Can Copy Right Now
- Building the Slide-by-Slide QBR Deck
- How Long Should a QBR Run, and Who Should Attend?
- What Sales KPIs Actually Belong on the Page
- How to Prepare and Run a QBR That Produces Decisions
- Rep-Level QBRs vs. Team QBRs vs. Executive Reviews
- Mistakes That Turn a QBR Into a Waste of Everyone's Time
- Customizing the Template for Your Industry and Sales Model
- Presenting the Numbers So the Room Actually Reads Them
- Weaving Customer Feedback Into the Review
- Keeping Every Stakeholder Engaged in the Room
- What Happens After the QBR Determines Whether It Mattered
- Practitioner Notes on Running QBRs at Scale
- Get Hands-On Help Turning This Template Into a Habit
- Templates and Guides Worth Bookmarking
- Sources
- FAQ
Sales QBR Template You Can Copy Right Now
A working quarterly business review sales template needs six sections and a header block, and that structure alone solves most of what makes QBRs feel like a waste of time. The sequence below preserves context from quarter to quarter and forces accountability instead of a status recap nobody remembers by Friday.
Start with the header:
- Account or team name, review period with exact dates, prepared by, and date sent
- Attendees list with titles
- Next renewal or milestone date
- One-line verdict: on track, at risk, or expanding, with one sentence of justification
Then six sections carry the substance.
| Section | What goes in it |
|---|---|
| 1. Last quarter's goals | Each goal agreed last quarter, paired with its result status |
| 2. Outcomes | Results stated in the customer's own numbers, sourced |
| 3. Adoption/usage | Usage metrics that show engagement, not just activity |
| 4. Issue log | What was reported vs. what actually shipped |
| 5. Risks & open questions | Anything that could stall renewal, expansion, or quota |
| 6. Next quarter | Goals with named owners, dates, and a single ask |
A worked example makes section 1 concrete. Adoption lagging in the operations team; training session booked for next month." That one line does more work than a page of bullet points because it names the gap and the fix in the same breath.
Keep outcomes tied to the customer's own numbers rather than your own success narrative, and cite where each figure came from. A short issue log works the same way: name the issue, the date it was reported, and the date it shipped or the estimated fix date. That single habit does more to build trust in a QBR than any polished slide.
Building the Slide-by-Slide QBR Deck
A slide-by-slide QBR deck for a 60-minute meeting typically runs 8 to 10 slides, and the discipline is in what you leave out, not what you add. Here's the sequence that keeps an executive's attention:
- Title and context (1 minute): account name, period, attendees, and the one-line verdict from your header.
- Executive summary (3 minutes): three sentences maximum. Did we hit the number, why, and what changes next quarter.
- Quota attainment (5 minutes): a single trend chart, not a spreadsheet dump.
- Pipeline health (7 minutes): coverage ratio, stage distribution, and aging deals.
- Forecast accuracy (5 minutes): committed vs. actual by month, with one explanation for the biggest miss.
- Win/loss analysis (5 minutes): top three reasons deals were won or lost, in the rep's or customer's own words where possible.
- Activity metrics (5 minutes): calls, meetings, and demos, shown only if they explain a result.
- Cross-functional alignment (5 minutes): where marketing, product, or support helped or blocked progress.
- Learnings (5 minutes): what surprised the team this quarter.
- Next-quarter game plan (15-20 minutes): goals, owners, dates, and the single ask, with the remaining time reserved for discussion.
Every slide needs one visual, one headline metric, and one takeaway written in a full sentence, not a fragment. If a slide needs a paragraph of explanation to make sense, it belongs in the appendix, not the main deck. Pulling pipeline visuals from a live diagnostics view rather than a static export also keeps the pipeline health slide from going stale between the deck's creation and the actual meeting.
How Long Should a QBR Run, and Who Should Attend?
Duration depends on scope. An individual rep review runs well at 75 minutes, enough time to cover four sections in depth without dragging. Team or territory reviews stretch from 60 to 180 minutes depending on headcount, and for a team of six reps, plan a half-day block split across two days rather than a single marathon session.
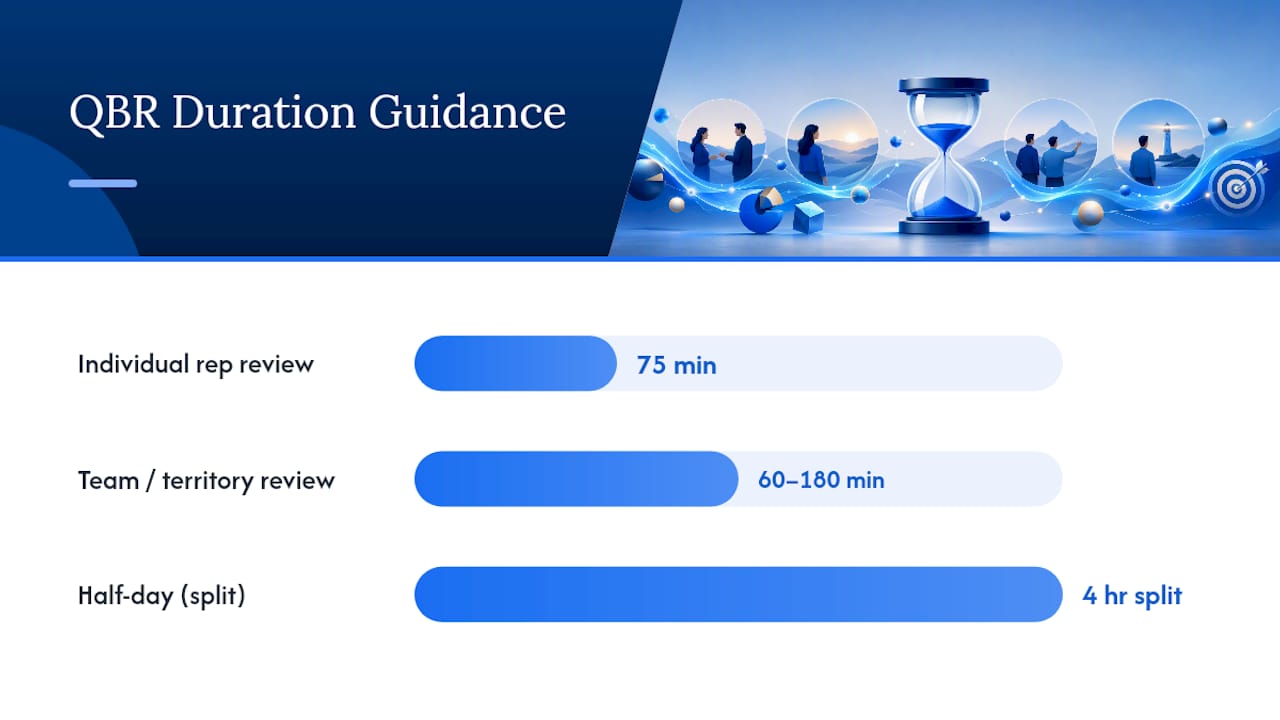
Time allocation matters more than total length. A QBR that spends an hour recapping numbers and ten minutes on what happens next has its priorities backward.
Invite deliberately, not by habit:
- The economic buyer or decision maker, so commitments made in the room actually stick
- The daily user or champion, who can validate adoption numbers in real time
- The account owner or rep running point on the relationship
- Relevant customer success, support, or RevOps staff, but only if they add a data point nobody else has
Cap attendance. Once a room passes eight or nine people, candid conversation dies and the meeting turns into a series of polite status updates.
What Sales KPIs Actually Belong on the Page
Every metric on a QBR slide should trace back to a formula the room can check. Vague trend lines invite vague conclusions. Concrete numbers force a decision.
It means the pipeline can't absorb even a modest run of lost deals without missing the number next quarter. Present each metric as a trend line against its own benchmark rather than a bare snapshot. Reviewing forecast accuracy against actuals works the same way, and a structured forecasting approach makes that slide far more defensible than a gut-feel estimate.
How to Prepare and Run a QBR That Produces Decisions
Preparation determines whether the meeting produces commitments or just a shared sense that things are fine. Follow this sequence:
- Gather the data at least a week out, including quota attainment, pipeline status, and the issue log.
- Assign slide ownership: the rep or account owner drafts outcomes and adoption; the manager drafts the executive summary and next-quarter plan.
- Send the deck 48 hours ahead, no exceptions. Attendees who read it beforehand ask sharper questions and skip the recap entirely.
- Confirm attendees and objectives the day before, so nobody discovers the meeting's purpose in the room.
- Open with the executive summary, not the title slide, if the group is time-pressed.
- Ask three diagnostic questions early: What surprised you this quarter? What's the biggest risk to next quarter's number? What do you need from us that you're not getting?
- Surface the top risks before anyone gets comfortable with the good news.
- Assign an owner and a due date to every commitment before moving to the next slide.
- Book the next QBR before the meeting ends. Skipping this step is the single most common reason QBRs turn into one-off events instead of an operating rhythm.
Pro Tip: Track owners in a simple three-column tracker, action, owner, due date, and review it at a 15-minute mid-quarter check-in. That one habit catches slipping commitments before they become next quarter's excuse.
Rep-Level QBRs vs. Team QBRs vs. Executive Reviews
The same template scales down or up depending on who's in the room.
- An individual rep QBR compresses to four sections, inputs, outputs, learnings, and game plan, and fits comfortably into 75 minutes with two to four slides.
- A team synthesis session runs 60 minutes and aggregates themes across reps rather than repeating each person's individual numbers, producing two or three shared initiatives the whole team owns.
- An executive business review replaces most operational detail with outcomes, risk, and one ask, since a VP or CRO cares about the trend and the decision, not the activity log.
- Territory reviews sit between rep and team formats, useful when one manager owns several reps covering the same market segment.
Choosing the right format is less about rigid rules and more about matching detail to the audience's actual decision-making power in the room.
Mistakes That Turn a QBR Into a Waste of Everyone's Time
Most bad QBRs share the same handful of failures.
- Data dumps. Fifteen slides of metrics with no interpretation leaves the room guessing what matters.
- Wrong attendees. No economic buyer means no real commitments get made.
- No named owners. Every action needs a person and a date, or it quietly disappears.
- Never booking the next QBR. This single omission is why so many teams run QBRs once and then let them lapse.
- Missing customer-facing metrics. A QBR that only talks about your pipeline, not the customer's outcomes, reads as self-serving.
Watch for red flags in the data itself: two consecutive quarters below quota, pipeline coverage under 2.5x, or deal slippage above 20%. Any one of those deserves its own agenda item, not a passing mention.
Pro Tip: Limit next-quarter goals to three. A deck with ten goals produces zero accountability because nobody remembers which three actually mattered by week six.
Customizing the Template for Your Industry and Sales Model
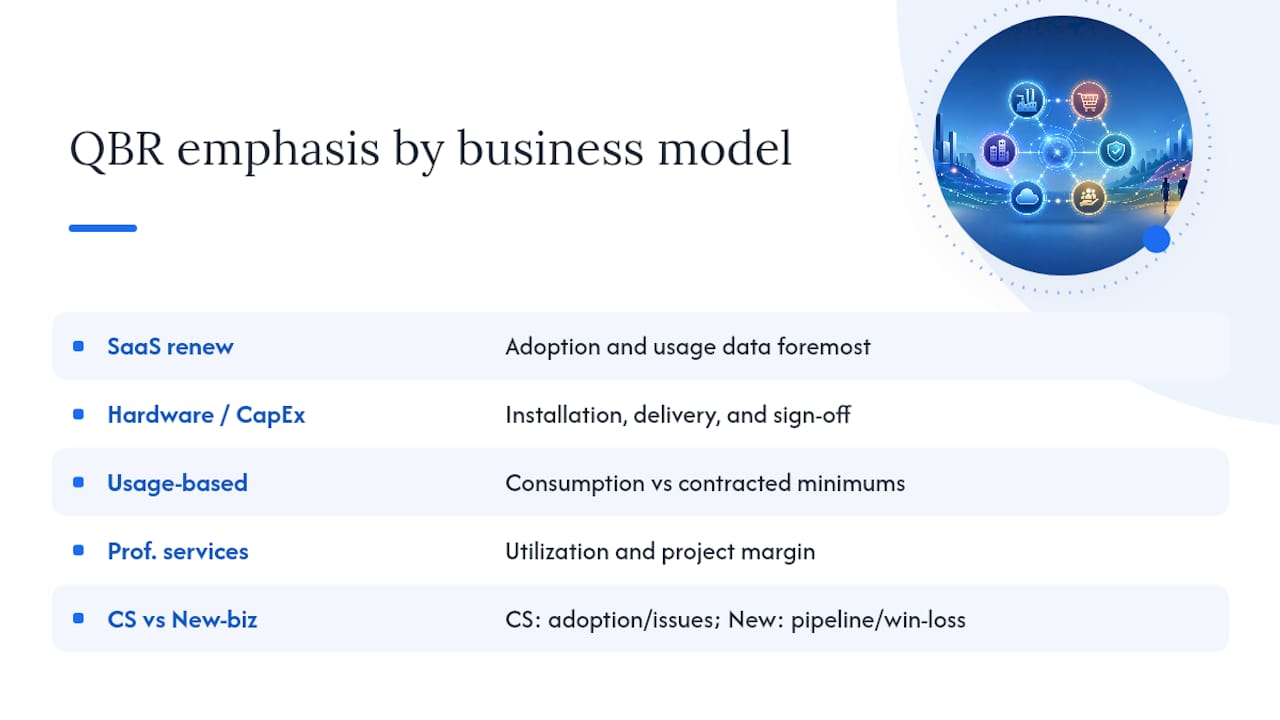
A SaaS renewal-driven business needs adoption and usage data front and center, since a shrinking usage curve predicts churn months before the renewal date. A hardware or capital-equipment sales team, by contrast, should weight the deck toward installation timelines, delivery status, and multi-stakeholder sign-off, since the sales cycle stretches far longer and the risks sit in logistics, not usage.
Usage-based and consumption pricing models change the header verdict itself: "on track" needs to reflect consumption trend against contracted minimums, not just renewal date proximity. A professional services or agency model should replace the pipeline coverage slide with utilization and project margin, since new-logo pipeline matters less than keeping current engagements profitable and renewed.
For a customer success QBR specifically, adoption and issue-log sections carry more weight than the win/loss slide, which barely applies once a deal is closed. A pure new-business sales team runs the opposite emphasis, spending more time on pipeline coverage and win/loss patterns than on adoption metrics that don't yet exist for a prospect.
The six-section structure holds across all of these. What changes is which section gets five minutes and which gets fifteen. A manager running QBRs across a portfolio of different account types should build one master template, then trim or expand sections per vertical rather than building a separate deck from scratch for each account type.
Presenting the Numbers So the Room Actually Reads Them
A metric buried in a table gets skimmed. A metric shown as a trend line against a benchmark gets discussed. That difference should shape every visualization choice in the deck.
Line charts work best for quota attainment and pipeline coverage over time, since the direction of the trend matters more than any single quarter's number. Bar charts fit win/loss reasons and deal-size distribution, where comparing discrete categories side by side beats a continuous line. A simple stacked bar showing pipeline by stage reveals where deals are getting stuck faster than a table of raw counts ever could.
Avoid pie charts for anything with more than three or four categories. They look tidy but make it nearly impossible to compare two similar-sized slices at a glance, exactly the comparison a QBR audience needs to make quickly.
Color coding the verdict, green for on track, yellow for at risk, red for expanding but at risk of overcommitment, gives the room a visual shorthand before you say a word. Keep the color scheme consistent slide to slide; switching what red means between the pipeline slide and the forecast slide creates confusion exactly when you need clarity most.
One number per slide headline, with supporting detail underneath, beats a slide title that tries to summarize three metrics at once. If a chart needs a legend with more than four items, it's carrying too much information for a live meeting and belongs in an appendix slide instead.
Weaving Customer Feedback Into the Review
Customer feedback belongs inside the outcomes and adoption sections, not as a bolted-on slide at the end. Pull direct quotes from support tickets, quarterly check-in calls, or NPS or CSAT comments, and attach them next to the metric they explain.
Where a customer success QBR is standing in for a full quarterly business review sales session with an external client, treat their feedback as the review's spine rather than a footnote. Ask for it in writing before the meeting, ideally through a short pre-QBR survey, so the feedback shows up in the deck instead of surfacing live and derailing the agenda.
Negative feedback deserves its place in the issue log, matched against a reported date and a resolution date or estimate, using the same format you'd use for an internal bug or delivery delay. That consistency signals the team treats customer complaints with the same rigor as internal accountability, not as a separate, softer category of problem.
Keeping Every Stakeholder Engaged in the Room
Engagement drops the moment a QBR turns into one person reading slides aloud. Open with a question instead of a statement, something like "before we look at the numbers, what's your read on how the quarter went?" That single move gets the room talking before the deck does the talking for them.
Assign each attendee a slide or a section to speak to ahead of time rather than having one person narrate the entire deck. A rep who presents their own pipeline slide engages differently than one watching a manager present it for them, and an economic buyer who's asked directly for their read on a risk slide stays present in a way a passive audience member doesn't.
Build in a real pause after the risks and open-questions section. Silence there usually means people are thinking, not that there's nothing to say, and rushing past it kills the one moment in the meeting built for candid pushback.
What Happens After the QBR Determines Whether It Mattered
A QBR without a follow-up system is a meeting that happened once and changed nothing. The fix is mechanical, not motivational.
Record every commitment in the same tracker used during the meeting, action, owner, due date, and share it with attendees within 24 hours while the conversation is still fresh. Schedule a mid-quarter coverage check, a 15 to 20 minute call focused solely on whether the named actions are on track, roughly six weeks after the QBR.
Treat a missed commitment the same way you'd treat a missed forecast number: flag it, name why it slipped, and decide whether to reassign it or extend the date, rather than letting it quietly vanish from the next deck. And confirm the next QBR date is already on every attendee's calendar before this one ends. A booked date on the calendar survives a busy quarter; a vague promise to "find time next quarter" almost never does.
Practitioner Notes on Running QBRs at Scale
Chad Burmeister has spent more than 25 years building and running sales and business development teams at companies including Informatica, RingCentral, and Cisco WebEx, and hosts The AI for Sales Podcast alongside authoring nine books on sales strategy, including AI for Sales 2.0.
The trade-off that matters most at scale: a manager running QBRs across forty or fifty accounts cannot run a full 75-minute session for every one. Shorten aggressively for smaller or stable accounts, expand only for accounts showing risk signals or expansion potential. Executive-level reviews should compress to outcomes and one ask, never a full metrics recap, because a CRO's attention is the scarcest resource in the room.
The rule that never changes regardless of scale: book the next review before the current one ends, and attach exactly one ask to the next-quarter plan. A plan with five asks gets none of them done.
— Chad
Get Hands-On Help Turning This Template Into a Habit
A copy-paste template gets you through one strong meeting. Building the habit across every account or rep on your team, where every QBR actually books the next one and every commitment gets tracked, is a different problem, and it's the one Chad Burmeister spends most of his consulting work solving for sales leaders.
Chad's background running SDR and BDR teams at companies like Informatica, RingCentral, and Cisco WebEx shapes the facilitation playbook, executive framing, and forecast discipline covered above. If your team needs a live workshop to install this rhythm rather than another template sitting in a shared drive, Chad's consulting and speaking services walk through facilitation training built around your actual pipeline data. For deeper frameworks on forecasting and AI-assisted pipeline management, his books on sales strategy cover the material in more depth than any single template can. DIY templates work well for teams that already have strong meeting discipline; teams still fighting to make QBRs stick usually get there faster with a facilitated session or two. Reach out through the site to book a working session before your next quarter closes.
Templates and Guides Worth Bookmarking
A few outside resources go deeper on specific pieces of the QBR process than any single article can cover.
The QBR Template guide includes the full six-section copy-paste text along with a 45-minute agenda variant. The slide-by-slide deck guide lays out ready-made slide content and time allocations for a 10-slide deck. The KPI-focused writeup breaks down benchmark formulas in more depth, useful if you want to build a custom KPI dashboard. For presentation design specifically, SERPView's client performance deck examples show slide layouts adaptable to a sales or customer success QBR.
Sources
- QBR Template (Free Quarterly Business Review Template)
- Sales QBR Template: Slide-by-Slide Guide (2026)
- The Sales QBR Template That Actually Improves Results
FAQ
What Is a QBR Format?
A QBR format is a structured meeting, usually 60 to 90 minutes, that reviews last quarter's goals and results, presents outcomes and adoption metrics, surfaces risks, and ends with a next-quarter plan that assigns named owners and dates to specific commitments.
Can You Provide an Example of a QBR Deck?
A typical QBR deck runs 8 to 10 slides: title and context, a three-sentence executive summary, quota attainment, pipeline health, forecast accuracy, win/loss analysis, activity metrics, cross-functional alignment, learnings, and a next-quarter game plan with owners and dates.
What Are Common Mistakes to Avoid in QBRs?
The biggest mistakes are data-dump decks with no interpretation, inviting the wrong attendees, failing to assign named owners and dates to action items, and forgetting to book the next QBR before the meeting ends.
What Are Some Free Templates for Sales?
Several sales QBR template resources offer free, copy-paste formats, including a six-section quarterly review template and a slide-by-slide deck guide with suggested time allocations for each slide.
How Long Should a Sales QBR Meeting Run?
An individual rep QBR works best at around 75 minutes, while team or territory reviews typically run 60 to 180 minutes depending on headcount and how many accounts need coverage.
What KPIs Should Every QBR Include?
Every QBR should track quota attainment, pipeline coverage ratio (a healthy range is 3x to 5x), win rate, average deal size, sales cycle length, and forecast accuracy, presented as trends against benchmark rather than single snapshots.