
Pipeline velocity measures how fast expected revenue moves through your sales pipeline, expressed in dollars per day. The canonical formula is (qualified opportunities × average deal size × win rate) ÷ sales-cycle length in days. Run that math on a clean, well-defined cohort and you get a single number that tells you whether your pipeline is speeding up, stalling, or quietly leaking revenue.
TL;DR:
- Calculating pipeline velocity separately for each sales motion reveals distinct performance issues, with SMB deals averaging around $5,000 per deal and enterprise deals over $150,000.
- Cycle length influences velocity twice as much as opportunities or deal size, making reducing sales cycle time the fastest way to improve overall pipeline flow.
- Reliable velocity measurement requires consistent data definitions, with at least 20 closed deals per period and regular pipeline hygiene practices to prevent stale or incomplete deals from biasing results.
- Tracking velocity on a cadence aligned with the sales cycle—weekly for short cycles and quarterly for long ones—avoids reacting to short-term noise and ensures meaningful trend insights.
- Diagnosing velocity changes involves examining whether opportunities, deal size, win rate, or cycle length shifted, with quick wins often found by addressing legal or procurement bottlenecks or refining qualification criteria.
Table of Contents
- What the Pipeline Velocity Model Actually Measures
- How Do You Calculate Pipeline Velocity Step by Step?
- Why Should You Calculate Velocity by Segment Instead of Company-Wide?
- Diagnosing a Velocity Change: The Driver-Tree Approach
- Tactics That Move Each Lever
- The Pipeline Hygiene Rules Behind a Trustworthy Number
- How Often Should You Measure Pipeline Velocity?
- Using the Model for Forecasting and Resource Decisions
- Where Sales Teams Get the Model Wrong
- Get Help Turning the Numbers Into a Faster Pipeline
- Sources
- FAQ
What the Pipeline Velocity Model Actually Measures
The formula only works if you define its four inputs the same way every time you calculate it. Sloppy definitions are the number one reason two people on the same team report different velocity numbers for the same quarter.
Qualified opportunities mean deals that cleared a specific stage gate, not every lead sitting in a CRM. Pick a gate (discovery completed, budget confirmed, whatever your process uses) and count only opportunities that passed it during your measurement window.
Average deal size trips up more teams than any other input. For one-time sales, use the closed contract value. For subscription businesses, pick one consistent metric rather than switching between annual contract value, total contract value, and first-year ARR depending on the deal. Mixing those metrics inside a single average makes the output meaningless.
Win rate can be calculated two ways: closed-cohort (opportunities that entered and exited the pipeline within the window) or open-pipeline (a rolling snapshot of everything currently active). Closed-cohort is cleaner for trend analysis. Open-pipeline is more useful for real-time forecasting.
Sales-cycle length needs a hard start and end rule, typically the day an opportunity is marked qualified through the day it closes, won or lost.
A few naming notes worth clearing up:
- "Pipeline velocity," "sales velocity," and "deal velocity" are used interchangeably in most sales organizations, though "sales velocity" sometimes refers to the whole-funnel version and "deal velocity" to a single-deal cycle time.
- Units matter: the output is dollars per day, not dollars per deal or dollars per month, so keep your measurement window consistent when comparing periods.
- Stage semantics have to match across reps and regions, or your qualified-opportunity count silently changes definition halfway through the quarter.
How Do You Calculate Pipeline Velocity Step by Step?
Calculating this correctly starts in the CRM, not in a spreadsheet formula.
- Pull the qualified opportunity count. Filter for opportunities that hit your qualification stage within the measurement window (a fiscal quarter is standard).
- Pull average deal size. Extract the amount field for closed-won deals in the same window and average it. Watch for one or two outlier enterprise deals skewing the mean; when that happens, report the median alongside the average.
- Calculate win rate. Divide closed-won opportunities by total closed opportunities (won plus lost) in the same cohort.
- Calculate average sales-cycle length. Subtract the qualification date from the close date for each closed-won deal, then average the result in days.
- Run the formula. Multiply opportunities by average deal size by win rate, then divide by cycle length.
Pro Tip: Pull created-date and close-date fields directly from your CRM export rather than relying on a dashboard widget. Dashboards often apply their own date filters that silently exclude deals still open at the time of the pull, which understates your opportunity count.
Here's a worked example.
(40 × $20,000 × 0.25) ÷ 45 = $4,444 per day
That single figure, calculated from opportunities, deal size, win rate, and cycle length, is what you track over time. Cohort-based calculation (only fully closed deals from a defined period) gives you a cleaner historical trend. Open-pipeline calculation gives you a live, noisier read that's more useful for weekly forecasting conversations.
Why Should You Calculate Velocity by Segment Instead of Company-Wide?
A single company-wide velocity number usually hides more than it reveals. SMB deals, mid-market deals, and enterprise deals run through fundamentally different processes, and blending them produces a number that describes no real cohort.
Define your motions first: SMB (deals typically under $10,000, self-serve or light-touch), mid-market ($10,000 to $75,000, one to two decision makers), and enterprise ($75,000-plus, multithreaded procurement with legal and security review). Then calculate velocity separately for each.
The differences show up fast once you split them out:
- An SMB motion might show 120 qualified opportunities, a $5,000 average deal size, a 35% win rate, and a 20-day cycle, producing roughly $10,500 per day.
- An enterprise motion in the same company might show 15 qualified opportunities, a $150,000 average deal size, a 20% win rate, and a 120-day cycle, producing $3,750 per day.
Blend those two and you get a number that overstates enterprise speed and understates SMB efficiency. Neither sales leader can act on it.
Segmentation isn't a nice-to-have layer on top of the model. Mixing motions hides both problems and opportunities that separate calculations would surface immediately, whether that's a stalling enterprise win rate or an SMB team that's ready for more pipeline volume than marketing is currently feeding it.
Diagnosing a Velocity Change: The Driver-Tree Approach
When your velocity number moves, the useful question isn't "did it go up or down." It's "which of the four inputs moved, and why." A driver tree displays all four inputs beside the velocity figure so the cause is visible at a glance instead of buried in a single aggregate number, a reporting practice worth building into any dashboard.
Because the formula is multiplicative, equal percentage moves don't carry equal weight. A 20% cut in cycle length has the same mathematical effect on velocity as a 20% increase in the numerator, but cutting cycle length is often operationally easier than generating 20% more qualified pipeline from scratch. That asymmetry is why cycle length and win rate deserve first attention in most diagnostic exercises.
Once a lever is flagged, the investigation steps are straightforward:
- If opportunity count moved, check whether marketing or SDR volume changed, or whether the qualification bar shifted.
- If deal size moved, check for a mix shift between motions rather than assuming pricing changed.
- If win rate dropped, pull lost-deal reasons for the period and look for a pattern (new competitor, pricing objection, a specific rep or region).
- If cycle length stretched, check for legal or procurement bottlenecks and stalled deals sitting untouched. Sales pipeline diagnostics built for exactly this kind of stall detection can shortcut the manual digging.
Tactics That Move Each Lever
Every input in the formula responds to a different set of actions, and treating them as one undifferentiated "improve the pipeline" initiative wastes effort.
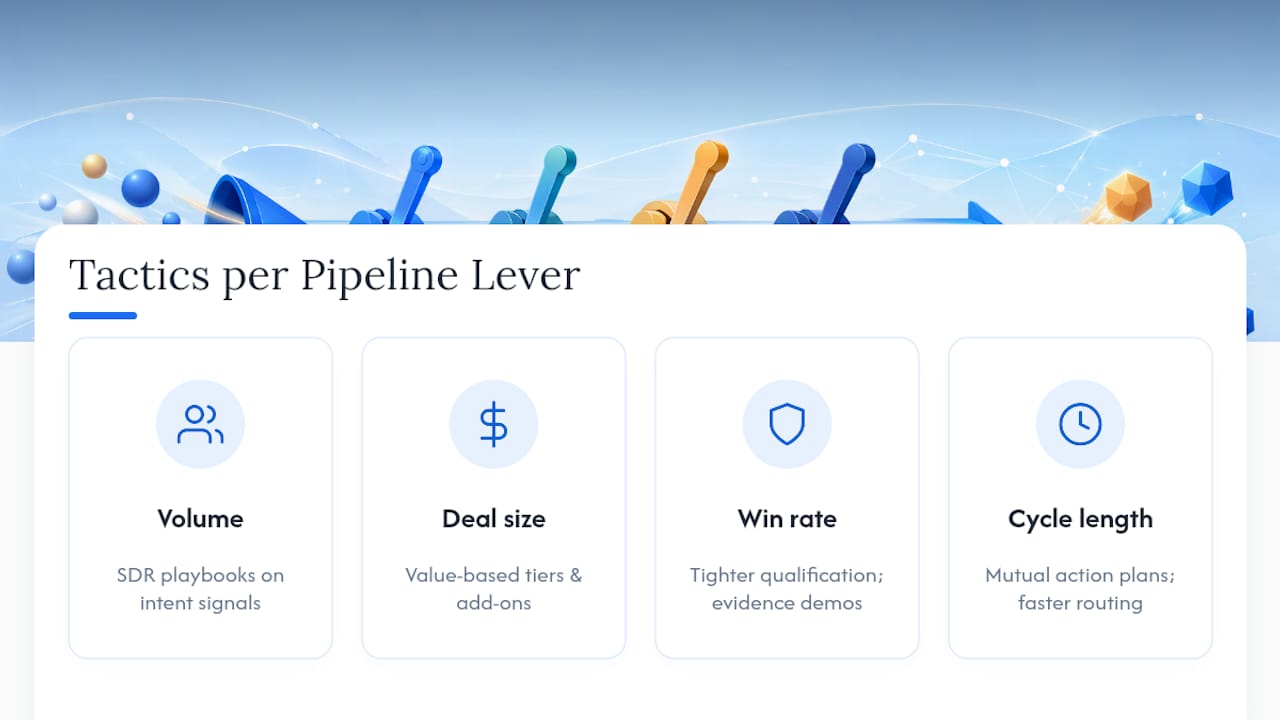
To increase qualified opportunity volume: build SDR playbooks around specific intent signals rather than generic cold outreach, run account-based programs against a named target list, and formalize channel partnerships that hand off pre-qualified leads instead of raw names.
To increase average deal size: test value-based pricing tiers instead of a single flat price, package add-ons that anchor the buyer to a higher starting point, and push annual billing terms where monthly is currently the default.
To raise win rate: tighten qualification criteria so fewer unqualified deals enter the count in the first place, rebuild demo scripts around evidence rather than feature tours, and equip internal champions with case studies specific to their industry.
To shorten cycle length: put mutual action plans in front of every opportunity past discovery, speed up lead routing so a qualified lead isn't sitting unassigned for a day, automate follow-up sequences instead of relying on rep memory, and pre-build contract templates for common deal structures. Multithreading tactics that engage multiple stakeholders early tend to compress cycle length more reliably than any single-threaded outreach effort, since deals with one contact are the ones most likely to stall waiting on an internal champion.
Pro Tip: If you can only fix one lever this quarter, fix cycle length first. It responds fastest to process changes, and unlike win rate, it doesn't require a large closed-deal sample to show a clean signal.
The Pipeline Hygiene Rules Behind a Trustworthy Number
A velocity model built on messy CRM data will confidently report a wrong number. Hygiene isn't a side task, it's a precondition for the formula to mean anything.
Run through this checklist on a recurring basis:
- Every stage has a written entry criterion, not a rep's judgment call.
- Stale deals (no activity for 30-plus days at most stages) get flagged and either reassigned or purged from the active count.
- Amount, close date, and stage fields are required, not optional, before a deal can move stages.
- Deals count as "closed" only when marked won or lost, never left open past their close date.
- Partial-period deals get excluded from a cohort calculation rather than force-fit into the wrong window.
Teams with clean pipeline hygiene report meaningfully better forecast accuracy and faster effective velocity, largely because attention shifts from chasing dead deals to working real ones. On sample size: don't trust a velocity number built from fewer than roughly 20 closed deals in the period. Below that threshold, one large or unusual deal skews the average enough to make the number noise rather than signal. A structured hygiene playbook with required-field enforcement and automated stale-deal tagging fixes most of this without adding manual review work.
How Often Should You Measure Pipeline Velocity?
Cadence should track your sales-cycle length, not a calendar default. Teams with short cycles (under 30 days) can measure weekly without much noise. Teams with 90-plus day enterprise cycles should measure monthly, and treat quarterly as the real trend line.
- Short-cycle SMB motions: weekly tracking, monthly trend review.
- Mid-market motions: monthly tracking.
- Long-cycle enterprise motions: quarterly tracking, since monthly enterprise samples are often too small to be reliable.
- Regardless of cadence, avoid reacting to a single bad week or month when closed-deal volume sits under 20 for that period.
Benchmark ranges vary enormously by motion, deal size, and industry, so treat any published "good velocity" figure as illustrative rather than a target to hit exactly. What matters more is the trend within your own motion over time. On dashboards, display the driver-tree table alongside the velocity number and set an alert threshold for a double-digit percentage swing in any single input, which is usually the earliest sign something upstream changed.
Using the Model for Forecasting and Resource Decisions
Once the formula is running cleanly, it becomes a planning tool, not just a reporting one.
- Translate velocity to a hiring number. If you need $50,000 per day in pipeline velocity and your current SDR team produces $30,000 per day, calculate how many qualified opportunities an additional SDR historically generates, then back into headcount.
- Translate $/day to a quarterly target. Multiply your velocity figure by roughly 90 days to sanity-check whether current pipeline supports the quarter's revenue goal.
- Stress-test against reality. Treat the model as directional, not exact. Sudden market shifts, a new competitor, or a pricing change can move win rate faster than a formula built on last quarter's data will predict.
Where Sales Teams Get the Model Wrong
The mistake I see most often is treating velocity as one number instead of a family of numbers by motion. A company blending SMB and enterprise data into a single velocity figure is usually just averaging away the exact insight that would tell a VP where to hire or where to fix qualification.
The second failure is reacting to noise. A win rate swing built on eight closed deals isn't a trend, it's a coin flip. Fix cycle length and hygiene first, since those levers respond fastest and carry the clearest signal. Build a driver-tree view, run mutual action plans on every stalled deal, and revisit the model quarterly, not weekly, if your cycles run long.
— Chad
Get Help Turning the Numbers Into a Faster Pipeline
Running the formula tells you where velocity is stuck. Fixing it usually takes an outside set of eyes that has actually rebuilt SDR motions and pipeline processes at scale, not another dashboard. An experienced sales leader brings operational expertise to consulting engagements, workshops, and speaking sessions built around AI-driven pipeline growth.

If your team needs hands-on leadership to diagnose which lever is actually stuck, an executive sales consulting engagement is the direct next step. Prefer self-study first? The playbooks in Chad's books cover AI-powered pipeline tactics in more depth than any single article can. Either way, start by reaching out through chadburmeister.com to talk through where your pipeline velocity model is telling you something worth acting on.
Sources
- Sales velocity: formula and levers (HubSpot)
- Pipeline Velocity Formula and Levers | Tenbound
- Pipeline hygiene improves forecast accuracy (Rework resources)
- What Is Pipeline Velocity? The Formula and How to Improve It - GTM Layer
- Pipeline Velocity Formula (And Why Yours Is Too High) - Fluid CRM Blog
FAQ
How Do You Calculate Pipeline Velocity?
Multiply qualified opportunities by average deal size by win rate, then divide by average sales-cycle length in days. The result is your pipeline's expected revenue flow in dollars per day.
What Are the Four Levers in a Pipeline Velocity Model?
The four levers are qualified opportunity count, average deal size, win rate, and sales-cycle length. Because the formula is multiplicative, an equal percentage improvement in cycle length or win rate often delivers the same velocity gain as a much harder-won increase in opportunity volume.
How Often Should I Recalculate Pipeline Velocity?
Measure weekly for short sales cycles under 30 days, monthly for mid-market motions, and quarterly for enterprise motions with long cycles. Avoid drawing conclusions from any period with fewer than about 20 closed deals.
What Are the Five Stages of a Sales Pipeline?
Most models use some version of lead qualification, discovery, proposal, negotiation, and closed (won or lost), though exact stage names vary by company. What matters for velocity calculations is that your qualification gate and close criteria stay consistent across every deal you count.
Should I Use One Pipeline Velocity Number for My Whole Company?
No. Calculate velocity separately for each sales motion, such as SMB, mid-market, and enterprise, since their opportunity volume, deal size, win rate, and cycle length typically differ enough that a blended average misrepresents all of them.